Data stories · 5 min read
87 cities had dirtier air than Delhi this October. Most were in Indonesia and Malaysia
Good Air ranked 467 cities in 7 Asian countries by October 2026 PM2.5 from government monitors. The 25 most polluted are all in Indonesia; Delhi is 88th.
 By the Good Air team
In this article · 7 sections
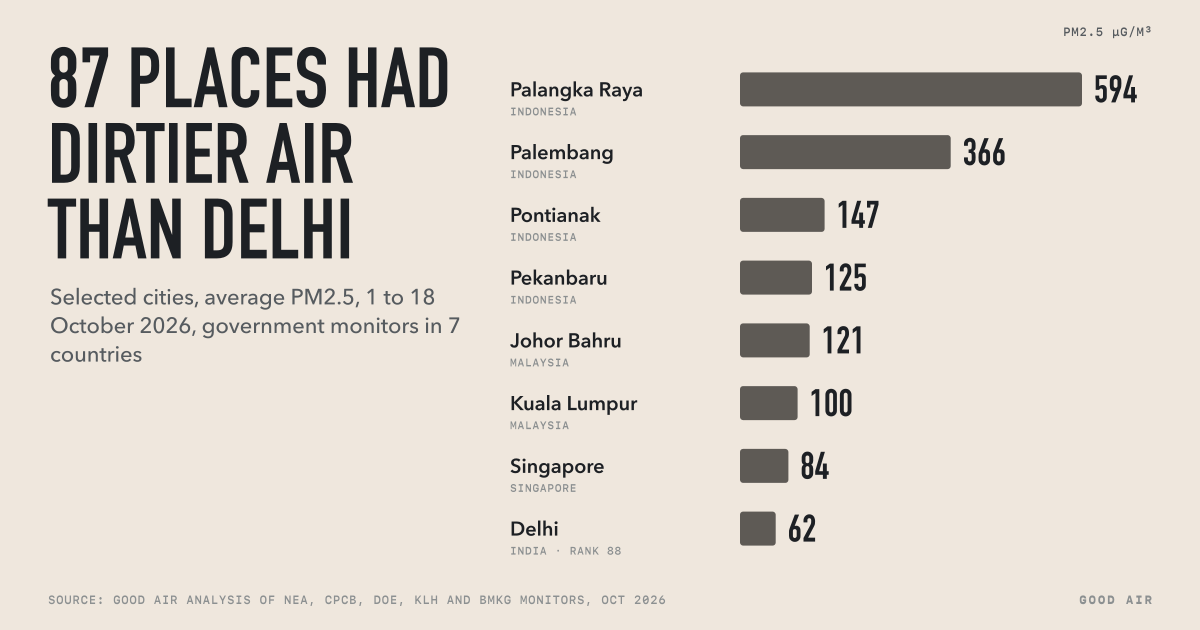
Delhi is usually the first city named in any list of Asia's most polluted cities. In October 2026 it was not even close to the top. Good Air ranked 467 cities in seven Asian countries by their average PM2.5 from 1 to 18 October, using only readings from government monitors. 87 cities had dirtier air than Delhi, and the 25 most polluted were all in Indonesia.
The cause is the smoke from peat and forest fires in Kalimantan and Sumatra. Palangka Raya, the capital of Central Kalimantan, averaged 594 µg/m³ of PM2.5 over those 18 days. That is nearly 10 times Delhi's 62 µg/m³, and about 40 times the World Health Organization's 24-hour guideline of 15 µg/m³. Singapore averaged 84 µg/m³ and had dirtier air than Delhi on 13 days in a row, from 5 to 17 October.
These numbers are our own analysis. You can download the full table and check every city.
Key findings
- Indonesia holds the top 25 places. Seven of the ten most polluted places are in Central Kalimantan. The worst, Murung Raya Regency, averaged 688 µg/m³.
- 38 cities averaged more than 100 µg/m³. 28 are in Indonesia and 10 in Malaysia. None are in India.
- Delhi ranks 88th of 467, at 62 µg/m³. The 87 places above it are 40 in Indonesia, 24 in Malaysia, 22 in India and Singapore.
- The most polluted Indian city is Ghaziabad, 48th, at 83 µg/m³.
- Kuala Lumpur (100 µg/m³) and Johor Bahru (121 µg/m³) both had dirtier air than Delhi on 16 of the 18 days.
- Indonesia also has the cleanest air in the table. Pangkalpinang, on Bangka island, averaged 3 µg/m³. Only 45 cities met the WHO guideline of 15 µg/m³, and 29 of them are in Thailand.
The league table
The table shows the ten most polluted places, then some well-known cities for comparison. PM2.5 is the average of daily means from 1 to 18 October 2026, in micrograms per cubic metre (µg/m³).
| Rank | City | Country | PM2.5 (µg/m³) |
|---|---|---|---|
| 1 | Murung Raya Regency, Central Kalimantan | Indonesia | 688 |
| 2 | Gunung Mas Regency, Central Kalimantan | Indonesia | 640 |
| 3 | Barito Selatan Regency, Central Kalimantan | Indonesia | 626 |
| 4 | Palangka Raya, Central Kalimantan | Indonesia | 594 |
| 5 | Banjarmasin, South Kalimantan | Indonesia | 423 |
| 6 | Kotawaringin Timur Regency, Central Kalimantan | Indonesia | 415 |
| 7 | Pangkalan Bun, Central Kalimantan | Indonesia | 404 |
| 8 | Tabalong Regency, South Kalimantan | Indonesia | 395 |
| 9 | Kapuas Regency, Central Kalimantan | Indonesia | 376 |
| 10 | Palembang, South Sumatra | Indonesia | 366 |
| 23 | Pontianak, West Kalimantan | Indonesia | 147 |
| 26 | Pekanbaru, Riau | Indonesia | 125 |
| 27 | Johor Bahru | Malaysia | 121 |
| 38 | Kuala Lumpur | Malaysia | 100 |
| 47 | Singapore | Singapore | 84 |
| 48 | Ghaziabad | India | 83 |
| 88 | Delhi | India | 62 |
| 89 | Hanoi | Vietnam | 61 |
| 131 | Abu Dhabi | United Arab Emirates | 53 |
| 207 | Jakarta | Indonesia | 41 |
| 381 | Bangkok | Thailand | 20 |
| 427 | Chiang Mai | Thailand | 14 |
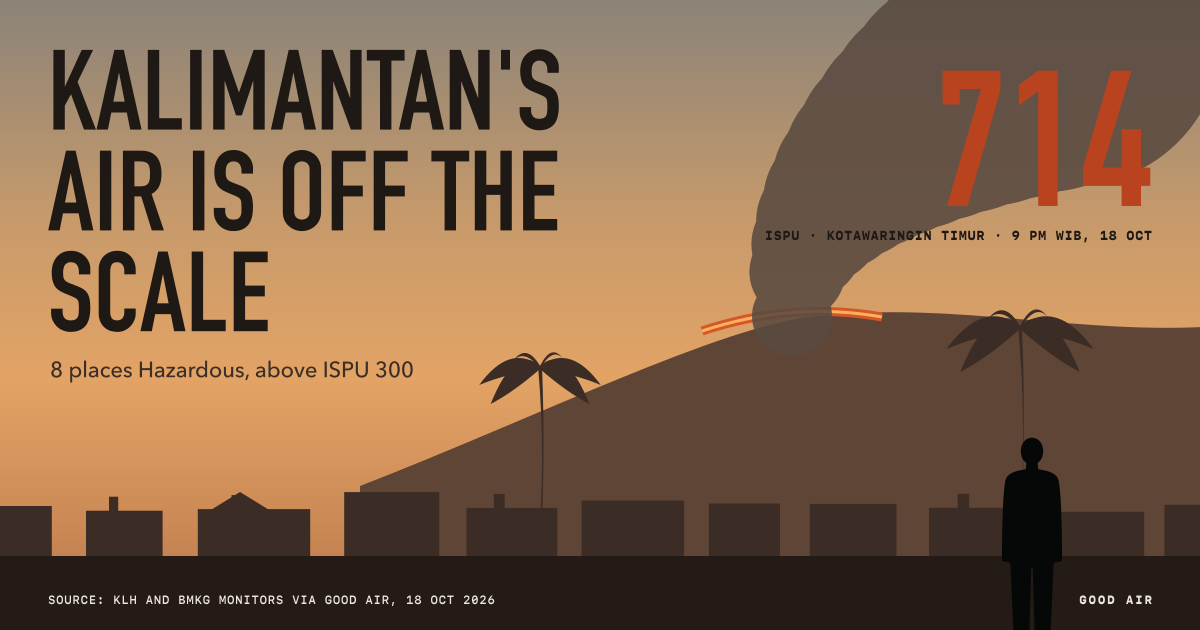
The worst single day in our data was in Palangka Raya on 11 October, when its daily mean reached 1,152 µg/m³. Local reporting put the city's air at hazardous levels for 37 days in a row by mid-October, with PM2.5 peaking at 2,512 µg/m³ (The Jakarta Post, 16 October).
Singapore against Delhi, day by day
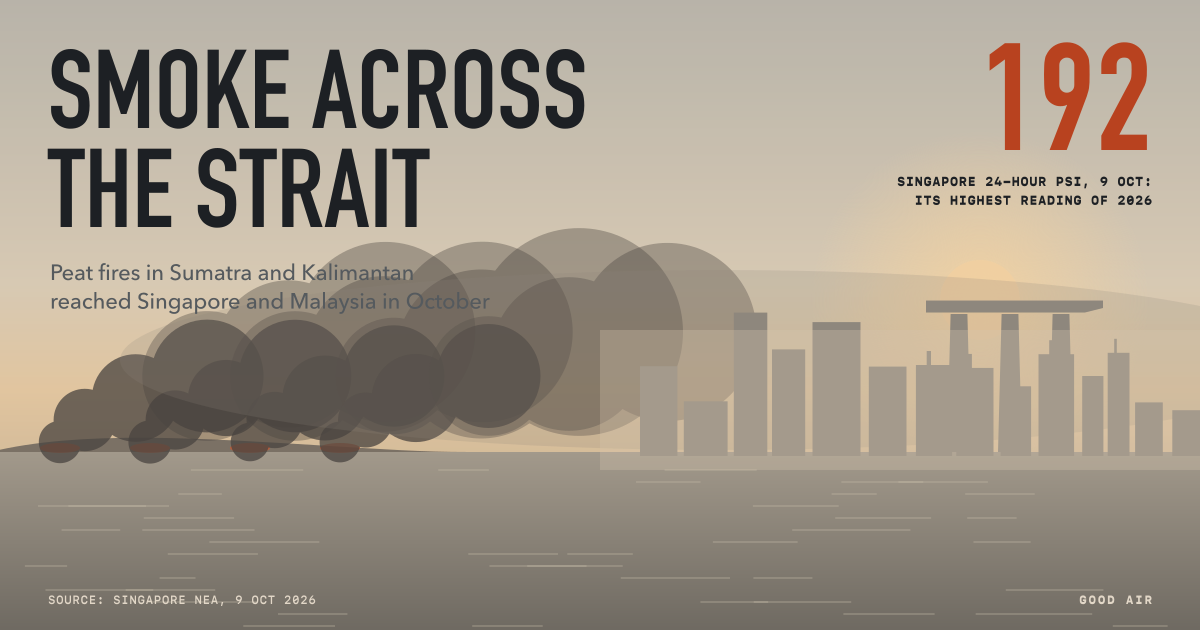
In the second half of September, Delhi's air was usually the dirtier of the two. Singapore averaged 40 µg/m³ and Delhi 44 µg/m³. October reversed that. From 5 October, smoke blowing in from Sumatra and then Kalimantan pushed Singapore above Delhi on every day up to 17 October. Its daily mean peaked at 139 µg/m³ on 15 October, the day NEA reported 24-hour PSI readings in the Very Unhealthy range.

The streak ended on 18 October, when a change in wind direction cleared some smoke from Singapore. Singapore's daily mean fell to 64 µg/m³, just below Delhi's 67. That evening NEA warned that winds may turn east-southeasterly on the night of 20 October and bring smoke from Kalimantan back (NEA, 18 October).
Why this is happening, and how long it may last
The smoke comes from fires on drained peatland. Peat can smoulder underground for weeks, and it gives off far more smoke than a surface fire. This year the fires coincide with a very strong El Niño, which has delayed the rainy season. Indonesia's weather agency BMKG said in September that the rains would arrive late in 61% of its forecast zones, with parts of Kalimantan not getting rain until November (BMKG, 22 September).
On 16 October the ASEAN Specialised Meteorological Centre raised its haze alert for the southern ASEAN region to Level 3, its highest (Kuwait Times/AFP, 17 October). Singapore's environment minister, Grace Fu, said the haze could persist for some time. She expects it to ease with the inter-monsoon period in late October or early November, and more when the Northeast Monsoon arrives in early December (Ministry of Sustainability and the Environment, 16 October).
The people paying the highest price are in Indonesia. The Health Ministry counted 283,270 cases of acute respiratory illness in seven provinces by 13 October (Mongabay, 16 October).
For the latest readings from every monitor in the region, see the Southeast Asia haze live tracker. For background on the fires, read our Kalimantan haze report.
What this does not mean for Delhi
Delhi has not suddenly become clean. 62 µg/m³ is still four times the WHO guideline. On 18 October CPCB rated Delhi's air Moderate, with an AQI of 187 (CPCB, 18 October). Delhi's worst weeks usually come in November and December, after Diwali and at the height of stubble burning. We explain why in why Delhi's air gets worse in winter.
What October 2026 shows is that "most polluted city" is a moving target. For three weeks, people in Palangka Raya, Palembang, Johor Bahru and Singapore breathed dirtier air than people in Delhi. Rankings that rely on yearly averages or on Delhi's reputation would have missed that.
How we measured
- Data. Hourly readings that Good Air collects from government monitoring networks: CPCB and state pollution control boards (India), KLH and BMKG (Indonesia), DOE (Malaysia), NEA (Singapore), PCD (Thailand), CEM (Vietnam), and NCM and EAD (UAE). We did not use satellite estimates, model output or low-cost sensors. China is left out because its feed had gaps in mid-October.
- City value. For each city, the mean of all its reporting monitors. For each day, the mean of that day's readings. We counted a day only if it had at least 12 hourly readings, and a city only if it had at least 14 of the 18 days.
- Period. 1 to 18 October 2026, using days in UTC, which is how our archive stores them.
- Why PM2.5, not AQI. Each country runs its own index (NAQI, ISPU, API, PSI). They use different scales and averaging, so their numbers don't compare. PM2.5 in µg/m³ does. Some networks report hourly PM2.5 and others 24-hour running averages. Over a daily mean the difference is small, but it is not zero.
- Caveats. Many Indonesian regencies have one monitor, so the figure for each is a single station. Singapore publishes five regional readings rather than individual stations, and we treat Singapore as one city. Our coverage is wide but not complete: Pakistan, Bangladesh and China are not in this table.
Use this data
The data is free to use and republish, with credit. Please cite it as: Good Air analysis of government air quality monitor data, 1 to 18 October 2026 (goodairapp.com).
- Full league table, 467 cities (CSV)
- Singapore, Delhi and Kuala Lumpur daily PM2.5, 15 September to 18 October (CSV)
We will update this ranking when the haze season ends.
Frequently asked questions
Which city had the most polluted air in Asia in October 2026?
In our data, Murung Raya Regency in Central Kalimantan, Indonesia, averaged 688 µg/m³ of PM2.5 from 1 to 18 October 2026. Of the larger cities, Palangka Raya was worst at 594 µg/m³. Our ranking covers India, Indonesia, Malaysia, Singapore, Thailand, Vietnam and the UAE, but not China, Pakistan or Bangladesh.
Is Singapore's air worse than Delhi's right now?
It was from 5 to 17 October 2026, when Singapore's daily average PM2.5 was higher than Delhi's for 13 days in a row. On 18 October they were close again (64 against 67 µg/m³). NEA expects smoke to return if the winds shift. Check Singapore's live reading and Delhi's for today.
How bad is 594 µg/m³ of PM2.5?
It is far beyond the top of most indices. The WHO's 24-hour guideline is 15 µg/m³, and the US AQI reaches its maximum of 500 at 325.4 µg/m³ in its current table. At these levels everyone should avoid going outdoors where possible and use a well-fitted N95 or KN95 mask if they must. See our mask guide.
Why is Delhi not at the top of this list?
Because the haze from Indonesia's fires is far heavier than Delhi's October smog, and because Delhi's worst season usually starts in November. Delhi's 62 µg/m³ is still unhealthy, at four times the WHO guideline.
Can I use these numbers in my article?
Yes. Credit "Good Air analysis of government monitor data (goodairapp.com)" and link to this page. The CSV files above contain every city and every daily figure behind the charts.
More on Indonesia →More on Malaysia →More on Singapore →More on India →