Data stories · 7 min read
Malaysia haze October 2026: Nilai and Batu Pahat were unhealthy on 20 of 22 days, and every Johor station on at least 16
Malaysia haze October 2026: Nilai and Batu Pahat had an unhealthy API on 20 of 22 days. All 68 DOE stations ranked, Johor to Sarawak, with the data.
 By the Good Air team

In this article · 7 sections
The Malaysia haze of October 2026 has been worst in a belt from Johor to Selangor. Good Air counted the days with an unhealthy Air Pollutant Index (API) at all 68 Department of Environment (DOE) monitoring stations from 1 to 22 October 2026. Nilai in Negeri Sembilan and Batu Pahat in Johor had a daily API above 100, the Unhealthy level, on 20 of the 22 days. All eight Johor stations were unhealthy on at least 16 days.
The worst day for the country was Wednesday 7 October, when 42 of the 68 stations averaged above 100. Only one station-day crossed 200, the Very Unhealthy level: Pasir Gudang on 16 October. The haze has eased since. On 22 October, 17 stations were above 100, and at 10 am on Friday 23 October the DOE listed 16 unhealthy areas, with Johan Setia in Selangor highest at 159 (The Star, 23 October).
This is our own count from the DOE's hourly API readings.
Key findings
- Nine stations were unhealthy on 19 days or more. Nilai and Batu Pahat (20 of 22), then Pasir Gudang, Larkin, Seremban, Johan Setia, Tangkak, Putrajaya and Cheras (19).
- The dirtiest air on average was at Pasir Gudang, with a mean daily API of 159 over the 22 days, followed by Nilai (156) and Larkin (154). Both Pasir Gudang and Larkin are in Johor Bahru district.
- The haze sat on one corridor. 22 of the 23 stations in Johor, Melaka, Negeri Sembilan, Selangor, Kuala Lumpur and Putrajaya were unhealthy on 14 days or more. Kuala Selangor, with 7, was the exception. Outside that belt, the most was Rompin in Pahang, with 15.
- Johor had no clean station. All eight were above 100 on 16 to 20 days.
- The north and Borneo were largely spared. 21 stations never had an unhealthy day, including both in Kelantan, Kangar in Perlis, Labuan, Langkawi, Kota Kinabalu and 9 of the 13 Sarawak stations we track.
- Over a third of all readings were unhealthy. Across the country, 546 of 1,494 station-days (37%) were above 100.
What the API levels mean
The API is Malaysia's official air quality index, published hourly by the DOE for each monitoring station. It is calculated from the 24-hour running average of the most dominant pollutant, which in a haze is fine particles (PM2.5) (DOE note on The Star's API tracker, 15 October). The DOE's five levels are (The Star, 23 October):
| API | Level |
|---|---|
| 0 to 50 | Good |
| 51 to 100 | Moderate |
| 101 to 200 | Unhealthy |
| 201 to 300 | Very Unhealthy |
| Above 300 | Hazardous |
How an API reading compares with Singapore's PSI and Indonesia's ISPU for the same air is explained in API vs PSI vs ISPU.
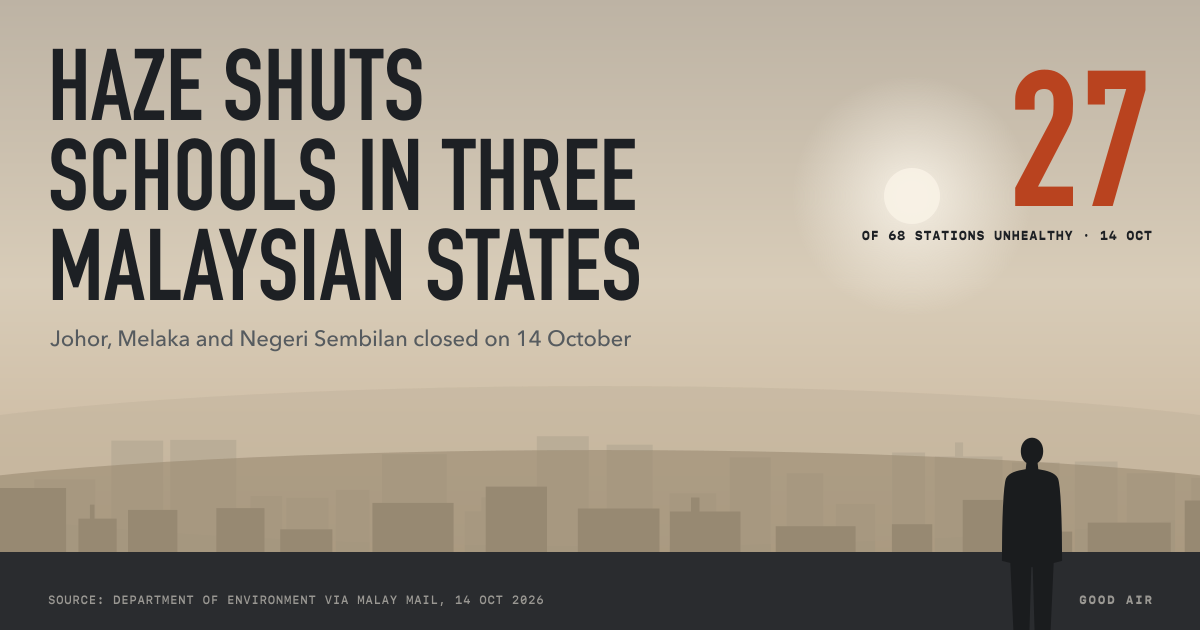
The levels have consequences. The Education Ministry told schools to suspend outdoor activities at once when the API goes above 100, and to close where it goes above 200 (Malay Mail, 8 October). States have also closed schools below 200. Our article on Malaysia haze school closures explains who decides, and which states shut.
Every badly hit station, ranked
The table ranks the 23 stations that were unhealthy on at least 14 of the 22 days, by the number of unhealthy days and then by mean API. "Worst day" is the station's highest daily average. Each station links to the Good Air city page that includes it.
| Rank | Station | State | Days above 100 | Days above 150 | Mean API | Worst day | Live page |
|---|---|---|---|---|---|---|---|
| 1 | Nilai | Negeri Sembilan | 20 | 16 | 156 | 188 (15 Oct) | Seremban |
| 2 | Batu Pahat | Johor | 20 | 16 | 150 | 199 (6 Oct) | Batu Pahat |
| 3 | Pasir Gudang | Johor | 19 | 17 | 159 | 201 (16 Oct) | Johor Bahru |
| 4 | Larkin | Johor | 19 | 15 | 154 | 191 (16 Oct) | Johor Bahru |
| 5 | Seremban | Negeri Sembilan | 19 | 16 | 149 | 188 (9 Oct) | Seremban |
| 6 | Johan Setia | Selangor | 19 | 13 | 149 | 188 (15 Oct) | Klang |
| 7 | Tangkak | Johor | 19 | 15 | 146 | 184 (9 Oct) | Tangkak |
| 8 | Putrajaya | Putrajaya | 19 | 13 | 145 | 181 (7 Oct) | Banting |
| 9 | Cheras | Kuala Lumpur | 19 | 13 | 145 | 183 (7 Oct) | Kuala Lumpur |
| 10 | Bukit Rambai | Melaka | 18 | 15 | 147 | 183 (9 Oct) | Alor Gajah |
| 11 | Bandaraya Melaka | Melaka | 18 | 14 | 142 | 181 (9 Oct) | Alor Gajah |
| 12 | Kluang | Johor | 18 | 14 | 141 | 179 (8 Oct) | Kluang |
| 13 | Kota Tinggi | Johor | 16 | 13 | 139 | 175 (17 Oct) | Pengerang |
| 14 | Alor Gajah | Melaka | 16 | 13 | 138 | 178 (9 Oct) | Alor Gajah |
| 15 | Batu Muda | Kuala Lumpur | 16 | 14 | 138 | 175 (7 Oct) | Kuala Lumpur |
| 16 | Shah Alam | Selangor | 16 | 13 | 138 | 175 (15 Oct) | Kuala Lumpur |
| 17 | Pengerang | Johor | 16 | 13 | 137 | 178 (16 Oct) | Pengerang |
| 18 | Klang | Selangor | 16 | 12 | 136 | 189 (15 Oct) | Klang |
| 19 | Segamat | Johor | 16 | 9 | 134 | 187 (8 Oct) | Segamat |
| 20 | Port Dickson | Negeri Sembilan | 16 | 11 | 132 | 172 (15 Oct) | Port Dickson |
| 21 | Rompin | Pahang | 15 | 10 | 123 | 175 (8 Oct) | Rompin |
| 22 | Petaling Jaya | Selangor | 14 | 13 | 132 | 171 (7 Oct) | Kuala Lumpur |
| 23 | Banting | Selangor | 14 | 11 | 129 | 171 (7 Oct) | Banting |
Below these, the two Kuantan stations had 10 and 11 unhealthy days, Kemaman and Paka in Terengganu 10 each, and IPD Serian 9, the most in Sarawak.
How the haze rose and fell

October began fairly clean: on 2 October only one station was above 100. The haze built from 4 October and peaked on 7 October, with 42 stations above 100. On 8 October, 33 stations were above 150, the most of any day. MetMalaysia had said the cross-border haze should ease from 9 October, as the inter-monsoon period brought weak winds, heavy rain and thunderstorms (The Star, 6 October). It did ease, to 19 stations on 11 October, but only for a few days.
A second peak came on 14 and 15 October, with 35 stations above 100 on each day. On 16 October, Pasir Gudang's daily average reached 201, the only Very Unhealthy station-day in our count. The DOE's own reading there was 203 at 8 am that day (New Straits Times, 16 October). Since 19 October, when 31 stations were still unhealthy, the count has fallen to 17 on 22 October.
The second wave also moved north-west. Johor stations led most days up to 18 October. Since then, the highest readings have come from Selangor, Kuala Lumpur, Melaka and Negeri Sembilan. On 20 October, Batu Muda and Johan Setia were the highest in the country at 172 at 9 am (Bernama, 20 October). On 22 October, Nilai led at 162 at 8 am, and in Johor only Tangkak (153) and Pasir Gudang (109) were still unhealthy (The Star, 22 October).
This was not the first wave. Our archive starts on 13 September, and on 15 September 44 stations were already above 100.
Johor: all eight stations unhealthy for most of October
Johor had the most consistently bad air of any state. Batu Pahat (20 days), Pasir Gudang, Larkin and Tangkak (19 each) and Kluang (18) are all in the top 12 of the ranking. Even Johor's least-affected stations, Kota Tinggi, Pengerang and Segamat, were above 100 on 16 days.
On 7 October, Johor closed all its schools for two days from 8 October, on the orders of the Regent of Johor, Tunku Mahkota Ismail, as the state's education committee chairman, Dr Muhammad Naqib Md Ghazali, announced (Bernama, 7 October). At 9 am on 8 October, all eight Johor stations were unhealthy, and Segamat had the highest reading in Malaysia at 187. That day, 38 of the 68 stations nationwide were unhealthy (Malay Mail, 8 October).
The live Johor readings are on our Johor Bahru page (Pasir Gudang and Larkin) and the other pages in the table. They lead with the US AQI from the latest hourly readings, which runs higher than the API. For school decisions, the DOE's API is the number that counts.
Why the haze came, and when it may end
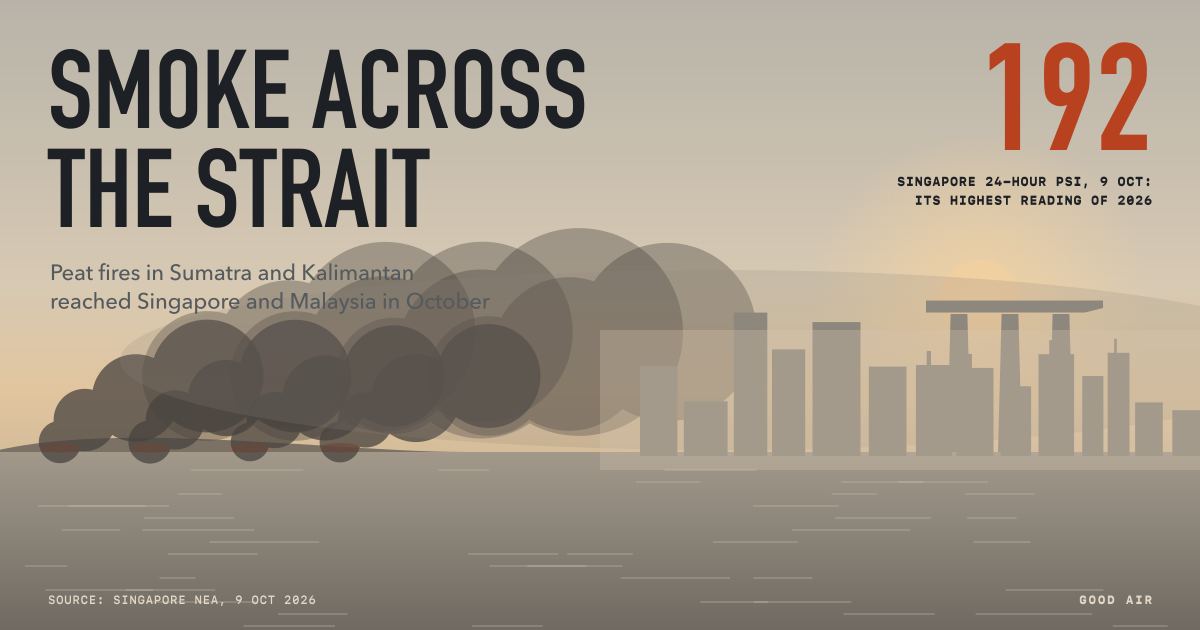
The smoke comes from fires in Indonesia. Satellite hotspots in Kalimantan and Sumatra reached 38,511 by 13 October, the most in a decade; the last higher count was 58,106 in 2015 (The Star, 15 October). On 7 October, the ASEAN Specialised Meteorological Centre (ASMC) predicted drier than usual conditions over most of the southern ASEAN region from 12 to 25 October (ASMC, 7 October).
MetMalaysia said the inter-monsoon period would last from 9 October until the end of October, ending the Southwest Monsoon, which began on 14 May (The Star, 6 October). Dr Norazian Mohamed Noor, an air quality researcher at Universiti Malaysia Perlis, expects the haze to improve gradually by the end of October, with more rain and a change in the winds. She said MetMalaysia's long-range outlook gives most of Malaysia close to normal rainfall until December. But she warned that rain in Malaysia alone cannot end the haze while fires keep burning in Indonesia, and that a 13 October forecast by Indonesia's weather agency, BMKG, showed low rainfall in parts of southern Sumatra and Kalimantan in some 10-day periods this month, with more rain in November and December (New Straits Times, 20 October).
No end date has been announced. For the regional picture, read Southeast Asia haze 2026 and follow the Southeast Asia haze live tracker.
How we measured
- Data. The hourly API that the DOE publishes for each of its 68 stations, collected by Good Air from the DOE's MyEQMS feed. Monitors only.
- Daily value. The average of the day's hourly API readings, for 1 to 22 October 2026. Days run from midnight to midnight UTC, which is 8 am to 8 am Malaysian time. A day counts only with at least 12 hourly readings. All 68 stations had 21 or 22 valid days. As the API is already a 24-hour running average, the daily mean stays close to published readings.
- Check against official readings. On 8 October, the DOE listed 38 unhealthy stations at 9 am, led by Segamat at 187 (Malay Mail, 8 October); our daily count was 39, with Segamat highest at 187. On 22 October, it listed 16 at 8 am, led by Nilai at 162 (The Star, 22 October); we counted 17, with Nilai at 161.
- Frozen monitors. We looked for stations that repeated the same reading all day or for days on end. We found none, so no station was dropped.
- Places. We rank stations, as the DOE does, not towns. Some of our city pages average several stations, so the table names the page that includes each one.
All of Malaysia's stations are live on our Malaysia air quality page.
Frequently asked questions
Which area in Malaysia has the worst haze?
From 1 to 22 October 2026, Nilai in Negeri Sembilan and Batu Pahat in Johor had the most unhealthy days, 20 of 22 each, in Good Air's count of DOE stations. Pasir Gudang in Johor had the highest average API, 159. At 10 am on 23 October, Johan Setia in Selangor had the highest reading, 159.
What is the API in Johor today?
All eight Johor stations had an unhealthy API on at least 16 days from 1 to 22 October. Readings then fell sharply: on the morning of 22 October only Tangkak (153) and Pasir Gudang (109) were still above 100, and at 10 am on 23 October Batu Pahat read 151 and Tangkak 144. For live readings, open Johor Bahru or Batu Pahat.
What API level is unhealthy in Malaysia?
An API of 101 to 200 is Unhealthy, 201 to 300 Very Unhealthy and above 300 Hazardous. 0 to 50 is Good and 51 to 100 Moderate. The Education Ministry tells schools to stop outdoor activities above 100 and to close above 200.
When will the haze end in Malaysia?
No date has been given. MetMalaysia's inter-monsoon period runs until the end of October, and a Universiti Malaysia Perlis researcher expects gradual improvement by then, but only if the fires in Sumatra and Kalimantan die down. On 22 October, 17 of the 68 stations were still unhealthy.