
Kuching air quality · Sarawak, Malaysia
Even healthy adults may notice throat irritation and mild coughing
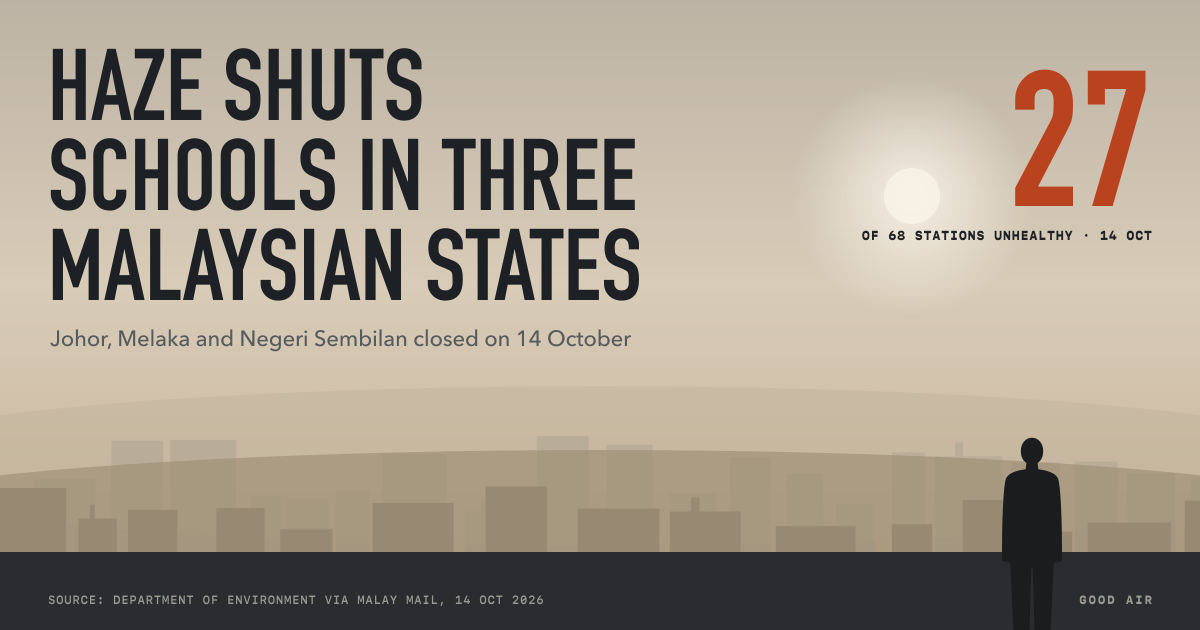
US AQI 157 (Unhealthy) in Kuching, from 2 DOE monitoring stations. Main pollutant: PM2.5.
Updated
Pollutants in Kuching
- PM2.5 · µg/m³63.94.3× WHO limit
Concentrations averaged across the city's stations. WHO multiples use the 2021 24-hour guidelines.
Is it safe outside in Kuching right now?
Some members of the general public may feel health effects; sensitive groups may feel more serious effects.
Walking and commuting
Take careKeep outdoor walks short and choose quieter streets away from traffic.
Running and jogging
AvoidMove your run indoors or reschedule for a cleaner hour.
Cycling
LimitKeep rides short and easy, or ride indoors.
Children playing outside
LimitLimit outdoor play to short, gentle sessions. Move sports indoors.
Older adults and heart or lung conditions
AvoidAvoid exertion outdoors. Follow your doctor's action plan.
Open windows
AvoidKeep windows closed while the air is unhealthy.
Mask outdoors
RecommendedWear a well-fitted N95 or FFP2 mask outdoors. Cloth and surgical masks do little against fine particles.
Air purifier indoors
RecommendedRun a HEPA purifier in the room you spend most time in.
Based on the US EPA Air Quality Guide, applied to the current US AQI category. If you have symptoms, follow your doctor's advice.
What US AQI 151–200 means for your health →
Air quality by area in Kuching
2 stations, worst first- KuchingUnhealthy157
- SamarahanUnhealthy157
Kuching air quality history
Daily average, 35 days- 162average daily US AQI over 35 days
- 213worst day, 23 September
- 76cleanest day, 30 September
- 26days at Unhealthy or worse
The last 7 days averaged 151, about the same as the week before (157). None of the last 35 days was Good.
Nearby cities
Malaysia rankingRelated reading
Kuching air quality: common questions
What is the AQI in Kuching right now?
The US AQI in Kuching is 157 (Unhealthy), based on 2 monitoring stations. The main pollutant is PM2.5.
Is it safe to go outside in Kuching today?
Limit time outdoors. Some members of the general public may feel health effects; sensitive groups may feel more serious effects. For runners: Move your run indoors or reschedule for a cleaner hour.
Which area of Kuching has the worst air right now?
Kuching has the highest reading at 157 (Unhealthy). Samarahan has the lowest at 157, out of 2 stations reporting.
How has air quality in Kuching been recently?
Over the last 35 days with data, Kuching averaged US AQI 162. The worst day was 23 September at 213; the cleanest was 30 September at 76. 26 days were at Unhealthy or worse.
How does Kuching's PM2.5 compare with the WHO guideline?
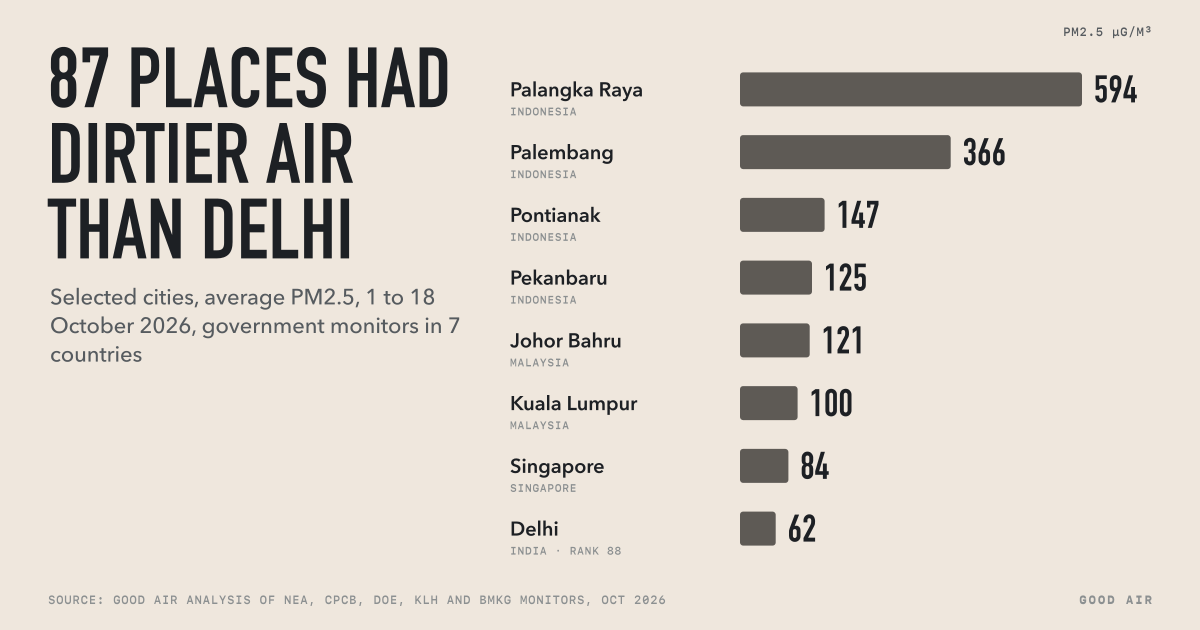
PM2.5 is 64 µg/m³, about 4.3 times the World Health Organization's 24-hour guideline of 15 µg/m³.
Where does Kuching's air quality data come from?
From Department of Environment Malaysia (DOE) · MyEQMS, using 2 monitoring stations in and around the city. Good Air does not estimate or adjust these readings.
Source: Department of Environment Malaysia (DOE) · MyEQMS. Readings are published by the monitoring agency and may be revised.