Explainers · 3 min read
US AQI vs India's AQI: why the same air gets two different numbers
The US AQI is stricter in cleaner air; India's NAQI climbs faster in heavy smog. Why the same air gets two numbers, with a conversion table.
 By the Good Air team
In this article · 5 sections
Open two air quality apps in Delhi and you may see 183 in one and 238 in the other, at the same moment, for the same monitors. Neither is wrong. They are using different scales.
India's official index is the National Air Quality Index (NAQI), published by the Central Pollution Control Board (CPCB). Many international apps and websites use the US EPA Air Quality Index. Both run from 0 to 500 and both use six colour-coded categories, but they turn pollution into numbers differently.
Good Air shows both on every Indian city page: NAQI first, because it is the official number, and US AQI alongside it for comparison with the rest of the world. See Delhi's live readings.
The short answer
- In clean to moderately polluted air, the US AQI is higher. The US scale calls PM2.5 above 9 µg/m³ "Moderate" and above 35 µg/m³ "Unhealthy for Sensitive Groups". India's NAQI calls anything up to 30 µg/m³ "Good" and up to 60 µg/m³ "Satisfactory".
- In heavy smog, India's NAQI is higher. NAQI's upper categories cover narrower bands of concentration, so the number climbs faster once PM2.5 passes about 80 µg/m³.
- The category words don't line up. "Moderate" means AQI 51 to 100 on the US scale, but 101 to 200 on India's.
The same PM2.5, two numbers
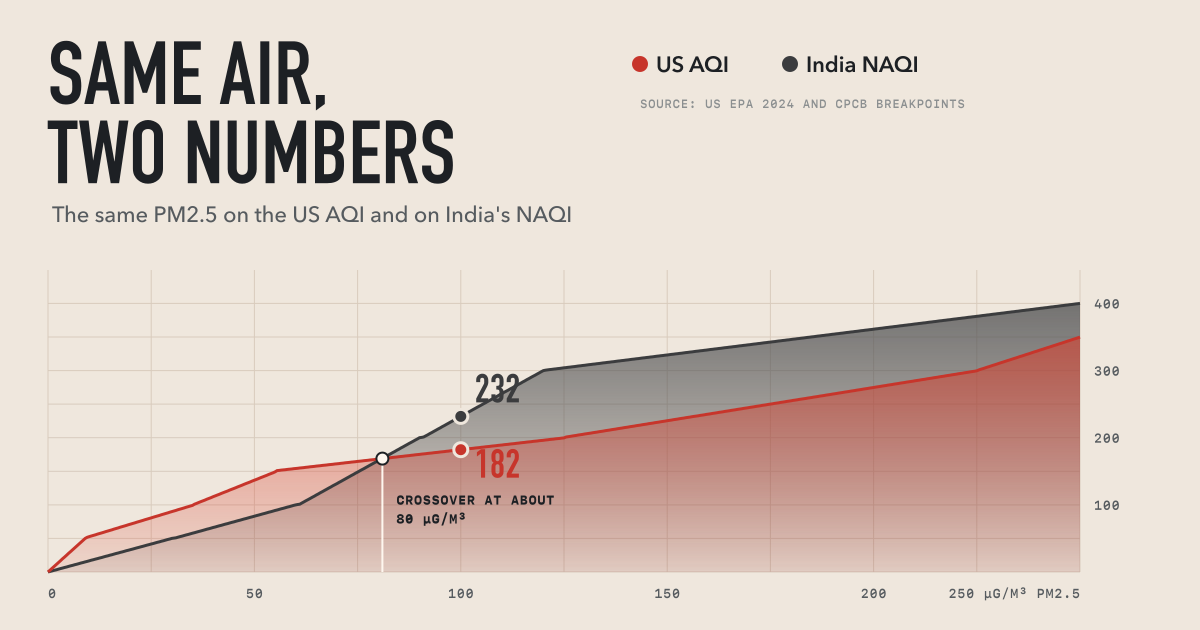
This table shows the sub-index each scale gives for PM2.5 alone, at the same concentration. We calculated it from each agency's published breakpoints: the US EPA's 2024 table and CPCB's NAQI table.
| PM2.5 (µg/m³) | US AQI | US category | India NAQI | NAQI category |
|---|---|---|---|---|
| 8 | 44 | Good | 13 | Good |
| 15 | 62 | Moderate | 25 | Good |
| 25 | 81 | Moderate | 42 | Good |
| 45 | 124 | Unhealthy for Sensitive Groups | 75 | Satisfactory |
| 60 | 154 | Unhealthy | 100 | Satisfactory |
| 75 | 165 | Unhealthy | 149 | Moderate |
| 90 | 175 | Unhealthy | 200 | Moderate |
| 100 | 182 | Unhealthy | 232 | Poor |
| 120 | 196 | Unhealthy | 300 | Poor |
| 150 | 225 | Very Unhealthy | 323 | Very Poor |
| 250 | 350 | Hazardous | 400 | Very Poor |
The crossover sits at around 80 µg/m³. Below it, the US number is higher; above it, India's is. That is why the gap can flip direction between a clean monsoon day and a smoggy November night.
The breakpoints side by side
| Category (US) | US PM2.5 (µg/m³) | Category (India) | NAQI PM2.5 (µg/m³) |
|---|---|---|---|
| Good (0 to 50) | 0 to 9 | Good (0 to 50) | 0 to 30 |
| Moderate (51 to 100) | 9.1 to 35.4 | Satisfactory (51 to 100) | 31 to 60 |
| Unhealthy for Sensitive Groups (101 to 150) | 35.5 to 55.4 | Moderate (101 to 200) | 61 to 90 |
| Unhealthy (151 to 200) | 55.5 to 125.4 | Poor (201 to 300) | 91 to 120 |
| Very Unhealthy (201 to 300) | 125.5 to 225.4 | Very Poor (301 to 400) | 121 to 250 |
| Hazardous (301 to 500) | 225.5 and above | Severe (401 to 500) | 251 and above |
The US EPA tightened its PM2.5 breakpoints in 2024, lowering the top of "Good" from 12 to 9 µg/m³. India's NAQI table dates from 2014.
Other reasons apps disagree
Even on the same scale, two apps can show different numbers:
- Averaging time. Officially, both indices are defined on 24-hour averages for particles. Live apps, including Good Air, use the latest hourly readings, which react faster to a sudden plume. CPCB's daily bulletin uses a 24-hour average, so it changes more slowly.
- Which pollutants count. NAQI takes the highest of up to eight pollutants. In much of North India, PM10 from dust often sets the NAQI number. On Good Air, the US AQI for Indian cities is calculated from particles (PM2.5 and PM10) for global comparability.
- Which stations. A city's number depends on which monitors are averaged. Delhi has dozens of stations whose readings can differ by more than 100 points at the same time. Some apps use the nearest station, some the worst, some the mean.
- Data quality. Monitors fail, freeze or drift. Good Air runs automatic checks on every Indian station and holds back readings that look physically implausible.
Which number should you trust?
Use whichever scale you can act on consistently, and pay attention to the category and the trend, not just the number.
- For official decisions in India, such as GRAP stages, school closures and construction bans, NAQI is the number that counts. How GRAP works.
- For your health, the US scale is closer to current international evidence, which finds harm at lower PM2.5 levels than India's thresholds imply. The World Health Organization's 24-hour guideline for PM2.5 is 15 µg/m³.
- For comparing cities across countries, use the US AQI. That is why Good Air's world ranking uses it.
Frequently asked questions
Is India's AQI the same as the US AQI?
No. Both run from 0 to 500 with six categories, but the pollutant breakpoints differ. The same air usually reads higher on the US scale when pollution is low or moderate, and higher on India's scale when it is severe.
Why does my app show a higher AQI than CPCB?
Most often because the app uses the US AQI, which is stricter for PM2.5 below about 80 µg/m³, or because it shows the latest hour rather than CPCB's 24-hour average.
What is a safe PM2.5 level?
The WHO's 2021 guidelines are 15 µg/m³ for a 24-hour average and 5 µg/m³ for the annual average. India's national standard is 60 µg/m³ for 24 hours and 40 µg/m³ annually.
Which AQI does Good Air use for India?
Both. Indian city pages show the official NAQI first and the US AQI alongside it. Rankings within India use NAQI; world rankings use the US AQI.