
Lubbock air quality · Texas, United States
–
US AQI
No monitor has reported here in the last few hours
Updated · AirNow
Pollutants in Lubbock
US values are per-pollutant AQI from the highest-reading monitor near Lubbock.
Lubbock air quality history
Daily average, 36 days- 23average daily US AQI over 36 days
- 56worst day, 17 September
- 9cleanest day, 1 October
- 0days at Unhealthy or worse
The last 7 days averaged 18, better than the week before (24). 35 of the last 36 days were Good.
Weather in Lubbock
No active National Weather Service alerts for Lubbock.
| Day | Forecast | High | Low | Rain |
|---|---|---|---|---|
| Mon 19 | Slight Chance Rain Showers | 73°F | 54°F | 15% |
| Tue 20 | Sunny | 73°F | 57°F | 3% |
| Wed 21 | Sunny | 79°F | 61°F | 0% |
| Thu 22 | Mostly Sunny | 79°F | 63°F | 5% |
| Fri 23 | Partly Sunny then Slight Chance Rain Showers | 75°F | 63°F | 34% |
| Sat 24 | Chance Rain Showers | 75°F | 59°F | 34% |
| Sun 25 | Chance Showers And Thunderstorms | 72°F | 57°F | 38% |
National Weather Service forecast. All US weather alerts →
Nearby cities
US rankingRelated reading
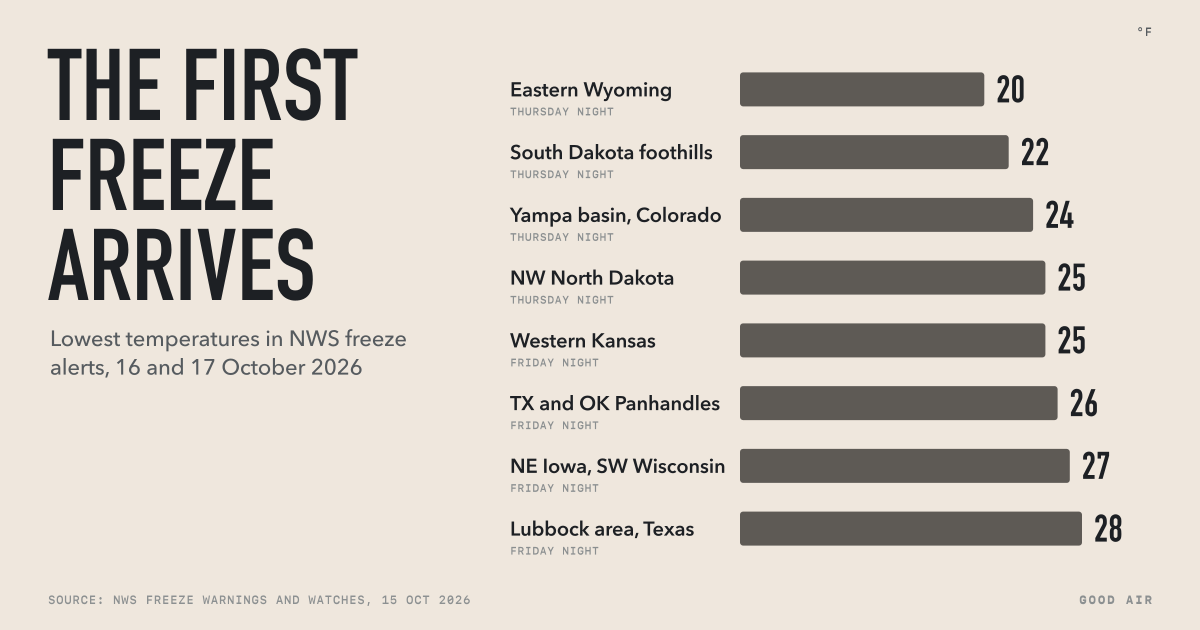 ExplainersFirst freeze of the season: what a freeze warning, freeze watch and frost advisory mean this weekend
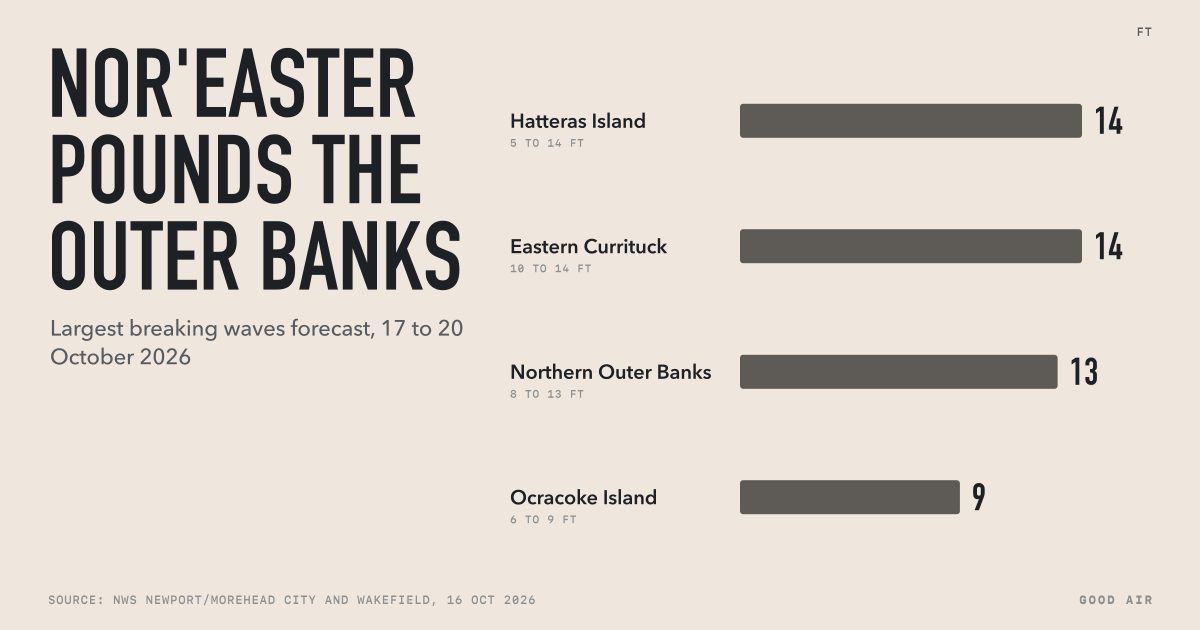 NewsNor'easter hits the Outer Banks: Hatteras visitors ordered out, NC 12 expected to close, 2 to 4 feet of flooding
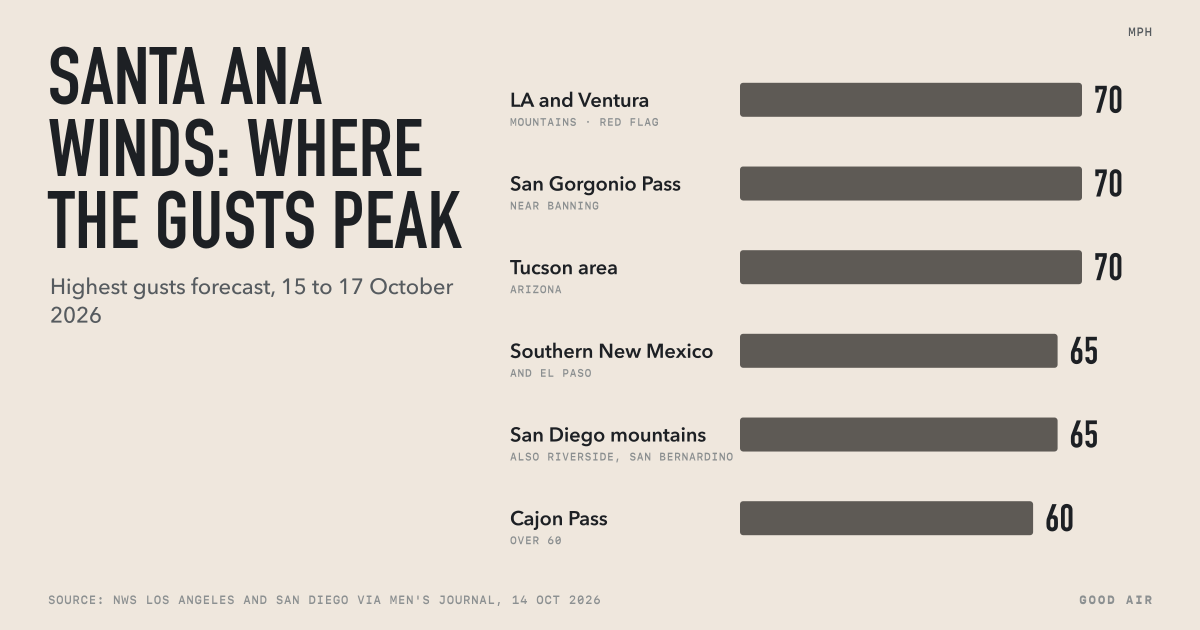 NewsSanta Ana winds: Norte Fire forces 16,000 from homes as red flag warnings, heat and power shutoffs run through Saturday
Lubbock air quality: common questions
How has air quality in Lubbock been recently?
Over the last 36 days with data, Lubbock averaged US AQI 23. The worst day was 17 September at 56; the cleanest was 1 October at 9. 0 days were at Unhealthy or worse.
Where does Lubbock's air quality data come from?
From US EPA AirNow. Good Air does not estimate or adjust these readings.
Source: US EPA AirNow. Readings are published by the monitoring agency and may be revised.