Explainers · 8 min read
Why air quality apps show different numbers: one Pittsburgh hour read AQI 55 and 179
Why do air quality apps show different numbers? Monitors, averaging, scales and models. One Pittsburgh hour ran from AQI 55 to 179, with no faulty monitor.
 By the Good Air team

In this article · 10 sections
Air quality apps show different numbers because they rarely report the same thing: they pick different monitors, average over different hours, use different scales, and sometimes show a model instead of a measurement. At 8 am on 26 October 2026, seven monitors within 25 km of Pittsburgh read from AQI 55 to AQI 179 in the same hour, Moderate to Unhealthy, and nothing suggests any of them was faulty.
So two apps can disagree with neither being wrong. Here is each cause, using EPA AirNow files and Good Air's monitor archive, and how to check any number yourself.
The seven reasons, in brief
- Monitors. Regulatory monitors, low-cost sensors, or a mix.
- Nearest or highest. One nearby monitor, the worst in an area, or an average.
- Averaging. One hour, EPA's NowCast, or 24 hours.
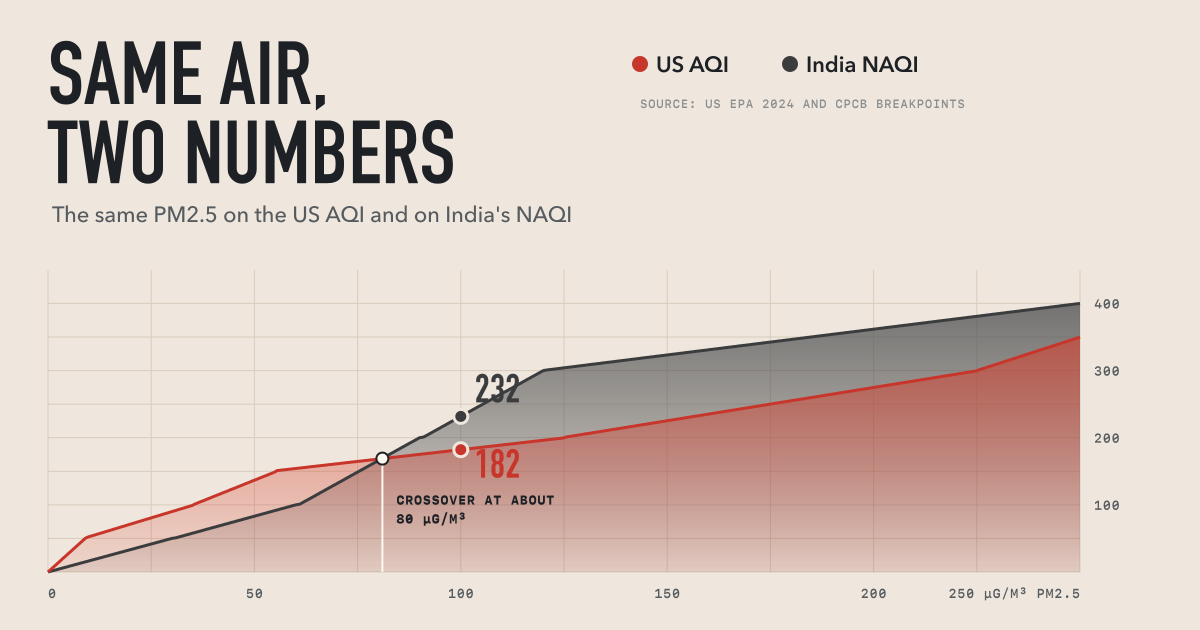
- Scale. US AQI, India's NAQI, Indonesia's ISPU and others score the same air differently.
- Sensor correction. Raw and corrected sensor readings differ.
- Model or measurement. Some numbers are calculated, not measured.
- Stale or broken data. A late, frozen or faulty monitor.
Same hour, different monitor
These are all the monitors within 25 km of Pittsburgh's city point with a PM2.5 reading at 8 am EDT on 26 October. PM2.5 is fine particle pollution (what it is).
| Monitor | AirNow reporting area | km from city point | PM2.5 that hour (µg/m³) | Current AQI |
|---|---|---|---|---|
| Liberty | Mon Valley Area | 16.9 | 96.7 | 179 Unhealthy |
| Clairton | Mon Valley Area | 18.8 | 40.5 | 119 Sensitive groups |
| Parkway East (near road) | Pittsburgh | 11.2 | 26.3 | 88 Moderate |
| North Braddock | Mon Valley Area | 12.2 | 24.1 | 75 Moderate |
| Avalon | Pittsburgh | 9.0 | 18.3 | 66 Moderate |
| Lawrenceville | Pittsburgh | 4.0 | 19.3 | 64 Moderate |
| South Fayette | Pittsburgh | 17.3 | 14.2 | 55 Moderate |
An app using the nearest monitor to downtown says 64. The highest monitor in AirNow's Pittsburgh reporting area gives 88. The highest within 25 km, which is Good Air's rule, gives about 180. EPA builds a reporting area's AQI from the highest concentration among its monitors, and says monitors in one area can show different categories (EPA technical document, May 2026).
We don't know what caused that spike, and we found no county notice for that morning. Allegheny County does issue separate Mon Valley warnings when an official monitor there exceeds the 24-hour PM2.5 standard (county release, 16 July 2026).
Pittsburgh was an extreme case. Across 77 US cities with at least three PM2.5 monitors reporting, from 26 October to 4 November, the highest and lowest monitor sat in different AQI categories in 35.8% of 16,127 city-hours. Almost all of those (98%) were Good against Moderate, and the median gap was only 3.9 µg/m³. Air was clean in most places, as in our October review, so small gaps straddled the line at 9.0. Newark and Houston disagreed in 76.6% of hours, partly because more monitors mean more chances to differ.
Same monitor, different averaging
Liberty alone gave several honest answers that day:
- Highest hour: 107.8 µg/m³, in the hour from 7 am.
- AirNow's current AQI: 179 at 7 am and 8 am.
- 24-hour AQI: 112, Unhealthy for Sensitive Groups, from a daily mean of 39.9 µg/m³ (AirNow daily file).
Put that 107.8 straight into the AQI table and you get 188, but EPA says it is not valid to calculate an AQI from hourly data. The AQI is defined on daily summaries. For real-time reporting EPA uses the NowCast, a weighted average of the last 12 hours that leans on the last three when air changes fast.
That smoothing lags when a plume clears. In the hour from 10 am, Liberty's PM2.5 had fallen to 24.9 µg/m³, but the NowCast was still 53 and the AQI 144. An app showing raw hourly data would have looked far better than AirNow then, and neither would be broken.

Same air, different scale
Run Liberty's 24-hour mean of 39.9 µg/m³ through other countries' PM2.5 tables and the number changes with no change in the air:
| Index | Value | Category |
|---|---|---|
| US AQI | 112 | Unhealthy for Sensitive Groups |
| Malaysia API | 87 | Moderate |
| Singapore PSI | 82 | Moderate |
| Indonesia ISPU | 81 | Sedang (Moderate) |
| India NAQI | 66 | Satisfactory |
We cover this in depth for the US and India and Southeast Asia's haze indices. Canada's Air Quality Health Index is a different kind of number, running 1 to 10+ from a mix of pollutants (Government of Canada, 14 October 2026).
The US scale also changed. From 6 May 2024, Good ended at 9.0 µg/m³ instead of 12.0, and Very Unhealthy and Hazardous start lower (EPA fact sheet, February 2024). So 10 µg/m³ is AQI 53 now and was 42 before. In our 10-day window, 11.9% of US monitor-hours fell between 9.1 and 12.0 µg/m³: Moderate now, Good on the old table.
Pollutants matter too. The AQI is the highest of several pollutants, so a PM2.5-only figure can read lower in an ozone-led hour.
Measured, corrected or modelled
Low-cost sensors need correction. EPA found PurpleAir sensors run high (EPA, 2021, updated 28 August 2026). In the main US study, raw data overestimated PM2.5 by about 40% in most of the country, and a correction cut the typical error from 8 to 3 µg/m³ (Barkjohn and colleagues, 2021). EPA's Fire and Smoke Map shows sensors only after quality checks and an extended version of that correction (EPA, 14 August 2026), so one sensor can differ between a raw map and EPA's. The main AirNow site does not include sensors.
Models calculate a value for a grid cell. Open-Meteo, a public service that Good Air uses as a labelled fallback, lists its global air quality source as a forecast at about 45 km resolution (Open-Meteo docs). For Liberty's coordinates that morning it gives 39.2 µg/m³ for the 7 am hour, against 107.8 measured. Its peak was 56.3 at 2 am, and at 8 pm the evening before it read 25.4 when the monitor read 7.3. It caught a dirty night, but not the peak or its timing. Liberty and South Fayette are about 28 km apart, so a cell that size can't separate them. Models help where no monitor exists, if labelled.

Stale, frozen and broken monitors
AirNow's real-time data are preliminary and not fully validated (AirNow fact sheet). Errors get through.
At 3 pm Pacific on 30 October, a monitor at Turner, Oregon, reported 1,726.4 µg/m³. An hour earlier it read 0.4. Silverton and Salem, close by, read 2.5 and 2.0. AirNow's file carried an AQI of 2,145 for two hours, and so did our own Salem figure, which went from 14 to 2,145 and back to 31. That was almost certainly a fault, and we passed it on.
Frozen monitors are the opposite problem. An Indonesian government station in Probolinggo sent US AQI 95 for 158 straight hours to 25 October, stamped fresh each hour. This looks rare in the US: one of 1,226 monitors in our window held a single PM2.5 value for 24 hours or more, and at 2.5 µg/m³ that may just be clean air.
Lahore this week: which number?
Press figures for Lahore show all of this at once. These are the reports we could open:
| When (2026) | Reading | Whose number | Reported by |
|---|---|---|---|
| Sun 1 Nov | 448 city, 617 Iqbal Town | "PMD sources" | Nation, 2 Nov |
| Mon 2 Nov, 8 am | 535, PM2.5 343 µg/m³ | IQAir | Minute Mirror, 2 Nov |
| Mon 2 Nov | 509 | "one monitoring update" | Minute Mirror |
| Tue 3 Nov, early | 447 | IQAir | LHR Times, 4 Nov |
| Tue 3 Nov | 433 | Punjab government dashboard | LHR Times |
| Tue 3 Nov | 902 Iqbal Town, 698 Paragon City | Private monitors | LHR Times |
| Wed 4 Nov, 5 am | 378 | Punjab government dashboard | LHR Times |
| Wed 4 Nov | 362 city, 722 Allama Iqbal | None named | 24NewsHD, 4 Nov |
| Thu 5 Nov, early | 344 | Good Air's ranking, 93 stations via OpenAQ | Our feed |
Time and network explain much of the spread, and one neighbourhood can read twice the city. None of these reports gives an averaging period. IQAir's 535 fits the US table: EPA extends the formula past 500, and 343 µg/m³ on that line gives 535. The 362 "city" figure equals the Model Town reading in the same report, so it may be one monitor. We can't tell.
What Good Air does, and doesn't
- US cities: we pass through AirNow's own per-monitor AQI and take the highest within 25 km of the city point (else the higher of the two nearest within 50 km). In a backtest of 9,552 city-hours this matched AirNow's own city values to the category 91.9% of the time, with a mean difference of 4.5 AQI. Pittsburgh shows its limit: our circle crosses AirNow's area line. The page names the monitor that set the figure.
- Other countries: the US AQI first everywhere except China, which leads with its national index. The official national index (India's NAQI, Indonesia's ISPU and others) sits beside it, labelled.
- Sensors and models: only stations are ranked. If a city's station goes quiet, we may show nearby OpenAQ sensors or a model estimate, labelled, and never ranked.
- Frozen monitors: a city whose reading has not changed for 24 hours shows as not reporting. If more than 30% of a country's cities freeze at once, we treat it as a feed outage and hide nothing. Readings pinned at 500 are exempt.
- What we don't do: we don't correct or recalculate US readings, and only our India feeds have a spike filter. That is why Turner got through. We also drop an AQI of 0, and any index whose main pollutant has no plausible reading.
Our sourcing rules are in our editorial standards.
How to check a number
- Find the monitor. Look for its name, then compare with AirNow or your state agency. For smoke, add the Fire and Smoke Map.
- Read the time stamp. Note the hour and time zone. Smoke can change a reading within an hour.
- Ask how it is averaged. Current AQI (NowCast), one hour or 24 hours?
- Check the scale. Then compare PM2.5 in µg/m³, which is the same in every country.
- Ask if it is measured. Look for a station count, or words like "estimate" or "forecast".
- Look at the neighbours. One monitor jumping alone is suspect. Several rising together is usually real.
If readings disagree and you are at risk, go by the higher nearby one and official guidance for that AQI range. See our AQI guide and live US readings.
How we measured
Pittsburgh figures come from AirNow's public hourly and daily files, which are preliminary. Hours are EDT. Our archive holds 180 where AirNow's file shows 179, a rounding difference. We rebuilt EPA's NowCast from the hourly readings to confirm what the archive stores. The national test uses PM2.5 NowCast concentrations at US monitors within 25 km of a Good Air city point, three or more reporting that hour. It covers 10 days of mostly clean autumn air, so it may not hold in smoke season, and it reflects our circle, not AirNow's reporting areas. Other countries' values are computed from published tables, not reported by those agencies.
Frequently asked questions
Which air quality app is the most accurate?
No app is accurate for every place and moment, because the answer depends on the monitor, the averaging and the scale. Look for one that names its monitors, shows a time stamp and labels estimates. In the US, compare against AirNow.
Why is my app different from AirNow?
Usually it uses another monitor, a different averaging time, or sensors or a model. AirNow's main site uses official monitors and the NowCast. Check the time stamp first, then the monitor name.
Why does PurpleAir read higher than AirNow?
Raw PurpleAir data tend to run high against regulatory monitors, by about 40% in most of the US in EPA's study. A sensor can also sit closer to a local source. EPA's Fire and Smoke Map shows corrected values.
Can the AQI go above 500?
Yes. EPA's Hazardous category is 301 and up, and its May 2026 document says values above 500 are calculated by extending the same formula. A display that stops at 500 will differ from one that does not, even on the same data.