News · 6 min read
Punjab stubble burning cases 2026: 542 farm fires by 23 October, nearly half in Tarn Taran
Punjab stubble burning cases 2026: 542 farm fires by 23 October, slightly more than last year, led by Tarn Taran and Amritsar. Fines, FIRs and the air.
 By the Good Air team

In this article · 8 sections
Punjab recorded 542 stubble burning cases (farm fires) between 15 September and 23 October 2026, and Tarn Taran district alone had 257 of them, according to official data reported by PTI (PTI via ThePrint, 24 October). Amritsar was second with 142. Together, the two border districts account for almost three in four of the state's farm fires this season.
That is slightly more than last year. By 22 October 2026 the Punjab Pollution Control Board (PPCB) count was 510; on the same date in 2025 it was 484. Only 34.82% of Punjab's paddy had been harvested by 23 October, so most of the season is still ahead.
Punjab's air worsened over the same days. Across six government monitors, the average daily India NAQI was 81 (Satisfactory) from 15 September to 19 October and 115 (Moderate) from 20 to 24 October, in Good Air's analysis below.
Key points
- 542 farm fires in Punjab from 15 September to 23 October 2026: Tarn Taran 257, Amritsar 142 (PTI, 24 October).
- The count more than tripled in ten days. It was 174 on 13 October, 404 on 20 October and 542 on 23 October.
- A little higher than 2025. 510 by 22 October 2026, against 484 by 22 October 2025, both PPCB figures.
- Enforcement: more than Rs 10 lakh in environmental compensation imposed in 206 cases, and 91 FIRs.
- Haryana: 12 farm fires from 15 September to 22 October.
- Our data: the six-monitor average was above 100 (Moderate) on every day from 20 to 24 October, and on only one earlier day.
How many farm fires has Punjab had so far?
Punjab counts farm fires from 15 September, two weeks before paddy procurement starts on 1 October. Fires are picked up by satellite and checked on the ground. The count stayed low until mid-October, then climbed fast and passed 500 on 22 October.
| Count up to | Farm fires since 15 September | Source |
|---|---|---|
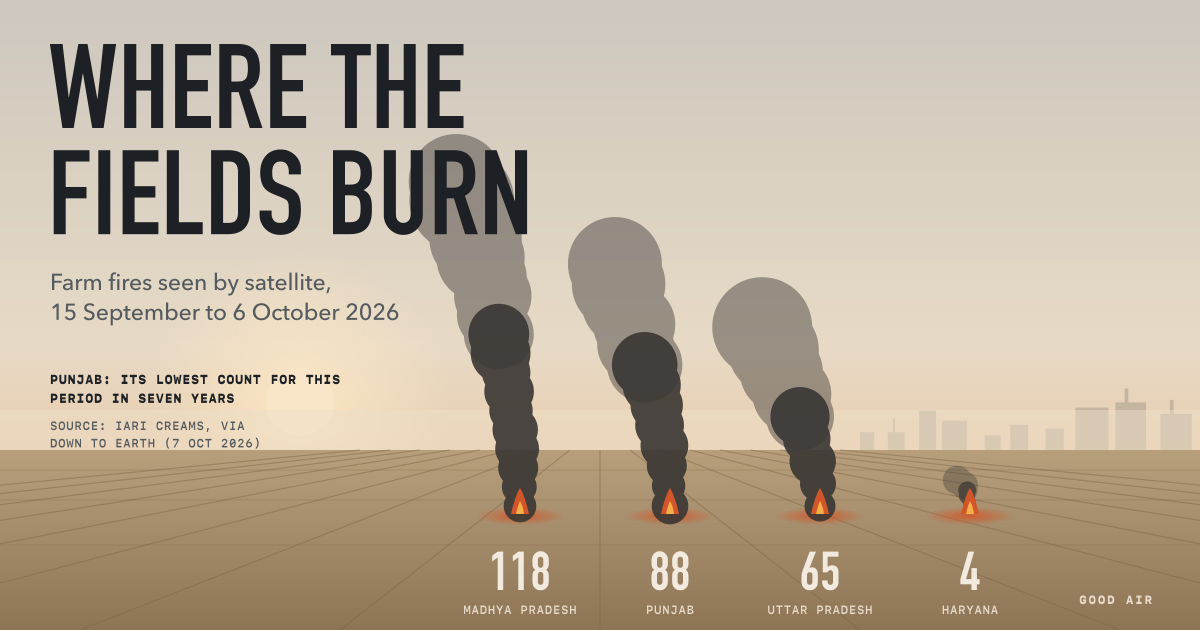
| 6 October | 88 | IARI CREAMS, via Down To Earth |
| 13 October | 174 | CAQM, via Rozana Spokesman |
| 20 October | 404 | PPCB, via IANS |
| 22 October | 510 | PPCB, via IANS |
| 23 October | 542 | Official data, via PTI |
The 88 by 6 October was Punjab's lowest for that period in seven years, according to the CREAMS laboratory at the Indian Agricultural Research Institute (Down To Earth, 7 October).
By 22 October, officials had inspected 467 of the 510 sites and confirmed stubble burning at 195, the PPCB report said (The Hans India, 23 October).
Which districts have the most stubble burning?
Tarn Taran and Amritsar, near the Pakistan border, lead by far. By 23 October, 73% of Tarn Taran's paddy had been harvested and 83% of Amritsar's, far ahead of the state as a whole (PTI, 24 October). On 13 October, eight districts, including Ludhiana, Bathinda and Rupnagar, had reported no fires at all (Rozana Spokesman, 16 October).
On Saturday 24 October, a team led by CAQM chairperson Rajesh Verma met the deputy commissioners of Amritsar and Tarn Taran. CAQM, the Commission for Air Quality Management, covers Delhi NCR and adjoining areas. The team said it was concerned at the rising number of fires and warned that "any laxity" would invite strict action (PTI via ThePrint, 24 October; The Tribune, 25 October).
Ferozepur is going the other way: 23 cases this year, against more than 50 at the same point in 2025 and 110 in 2024. The district credits sending straw to pellet plants, brick kilns and industry (The Tribune, 23 October).
Is it worse than last year?
Slightly, so far. Both comparisons below use PPCB data for the same date.
| Count up to | 2025 | 2026 |
|---|---|---|
| 13 October | 126 | 174 |
| 22 October | 484 | 510 |
Sources: Rozana Spokesman, 16 October 2026; PTI via Deccan Herald, 23 October 2025; IANS, 23 October 2026.
The gap has narrowed, from 48 more fires than last year on 13 October to 26 more on 22 October. The full 2025 season had 5,114 fires, down from 10,909 in 2024 (Rozana Spokesman) and 36,663 in 2023 (Deccan Herald). About two-thirds of the 2026 paddy is still in the fields.
Fines, FIRs and red entries
| By 22 October 2025 | By 22 or 23 October 2026 | |
|---|---|---|
| Cases with environmental compensation | 226 | 206 (23 Oct) |
| Compensation imposed | Rs 11.45 lakh | more than Rs 10 lakh (23 Oct) |
| Compensation recovered | Rs 7.40 lakh | Rs 5.45 lakh (23 Oct) |
| FIRs registered | 184 | 91 (23 Oct) |
| Red entries in land records | 187 | 166 (22 Oct) |
PPCB and police data as reported by PTI, 23 October 2025, PTI, 24 October 2026 and IANS, 23 October 2026.
- FIRs are filed under Section 223 of the Bharatiya Nyaya Sanhita, for disobeying an order of a public servant. Of the 91 so far, 45 are in Tarn Taran and 13 in Amritsar.
- A red entry is a mark in the farmer's land record. It bars the farmer from taking a loan against the land or selling it.
- Satellite to FIR. In Kapurthala, police booked a farmer after a Punjab Remote Sensing Centre satellite alert was checked in the field (The Tribune, 21 October).
Punjab has more fires than at this point last year, but about half as many FIRs.
How Punjab's air changed as the fires rose
We took the daily India NAQI from six government monitors in Punjab, 15 September to 24 October 2026. For five weeks the air was mostly Satisfactory; in the last five days, mostly Moderate.

| Monitor | NAQI, 15 Sep–19 Oct | NAQI, 20–24 Oct | Days above 100, 15 Sep–19 Oct | Days above 100, 20–24 Oct | PM2.5 µg/m³, 15 Sep–19 Oct | PM2.5 µg/m³, 20–24 Oct |
|---|---|---|---|---|---|---|
| Jalandhar (Civil Line) | 99 | 152 | 18 of 35 | 4 of 5 | 54 | 73 |
| Ludhiana (PAU) | 88 | 139 | 10 of 35 | 5 of 5 | 46 | 68 |
| Bathinda (Hardev Nagar) | 88 | 135 | 10 of 35 | 5 of 5 | 36 | 66 |
| Patiala (Model Town) | 67 | 103 | 4 of 34 | 3 of 5 | 25 | 47 |
| Amritsar (Golden Temple) | 86 | 102 | 2 of 35 | 4 of 5 | 48 | 56 |
| Rupnagar (Ratanpura) | 58 | 57 | 0 of 35 | 0 of 5 | 19 | 22 |
| Average of six | 81 | 115 | 44 of 209 | 21 of 30 | 38 | 56 |
- The jump came on 20 October. The six-monitor average went from 91 on 19 October to 126, and peaked at 127 on 23 October. The one earlier day above 100 was 24 September (106).
- Four of six rose sharply. Ludhiana went from 88 to 139, Bathinda from 88 to 135 and Patiala from 67 to 103. Jalandhar had the highest mean in both periods and the only Poor day (above 200): 215 on 20 October.
- Rupnagar stayed flat, at 58 then 57. Its monitor is run by Ambuja Cements, and the district had reported no farm fires as of 13 October.
- Amritsar rose less, from 86 to 102.
Our data cannot say what caused the change; farm smoke is one possible source among several, and weather matters too. CPCB's official figures point the same way. In its 4 pm bulletin, Ludhiana went from 93 on 15 October to 169 on 24 October, and Patiala from 66 to 132 (CPCB, 15 October; CPCB, 24 October). For today's reading, open the city pages above or the Punjab air quality page.
Haryana and Delhi
From 15 September to 22 October, satellites counted 1,507 crop residue fires in six states and Delhi: Punjab 510, Madhya Pradesh 400, Rajasthan 308, Uttar Pradesh 193, Uttarakhand 83 and Haryana 12 (Asianet Newsable, 23 October).
The same report cited IITM Pune's Decision Support System, which estimates where Delhi's PM2.5 comes from. It put stubble burning's share at 7.4% on Thursday 22 October and 15.9% on Friday 23 October. Transport was the largest single source, at 17.32%. CAQM invoked GRAP Stage 1 across Delhi NCR on 21 October; Delhi's AQI was 191 (Moderate) in CPCB's 24 October bulletin. See the Delhi tracker for the latest, and our stubble burning explainer for why farmers burn.
How we measured
- Data. Hourly readings from CPCB-network monitors (five run by PPCB, one by Ambuja Cements), collected by Good Air. No satellite, model or low-cost sensor data.
- Index. India's NAQI as reported each hour, averaged over the day. Days run midnight to midnight UTC (5:30 am to 5:30 am in India), so our figures differ slightly from CPCB's 4 pm bulletin.
- Valid days. A day counts only with at least 12 hourly readings. Patiala had one short day; the other five monitors had all 40.
- Left out. Khanna and Mandi Gobindgarh, whose monitors repeated almost the same hourly readings day after day from late September, a sign of a stuck feed.
- Averages. Means of daily values only; we never use hourly maxima.
Frequently asked questions
How many stubble burning cases has Punjab had in 2026?
Punjab recorded 542 stubble burning cases between 15 September and 23 October 2026, according to official data reported by PTI on 24 October. Tarn Taran had 257 and Amritsar 142. The count was 174 on 13 October, so it more than tripled in ten days. About a third of the paddy had been harvested.
Which district in Punjab has the most stubble burning?
Tarn Taran, with 257 of Punjab's 542 farm fires up to 23 October 2026, followed by Amritsar with 142. In both districts most of the paddy has been harvested, 73% in Tarn Taran and 83% in Amritsar. Ferozepur has reported only 23 cases this year, fewer than half of last year's count at the same point.
Is stubble burning in Punjab higher than last year?
Slightly. By 22 October 2026, PPCB counted 510 farm fires in Punjab, against 484 by 22 October 2025. On 13 October the figures were 174 and 126. The full 2025 season ended at 5,114 fires, the lowest in years, so 2026's total depends on how the rest of the harvest goes.
What action is taken against farmers who burn stubble in Punjab?
Officials can impose environmental compensation, register an FIR under Section 223 of the Bharatiya Nyaya Sanhita, and make a red entry in the land record, which bars loans against the land or its sale. By 23 October 2026, compensation had been imposed in 206 cases and 91 FIRs registered. By 22 October, 166 red entries had been made.
How much is stubble burning adding to Delhi's pollution?
The Decision Support System run by IITM Pune put stubble burning's share of Delhi's PM2.5 at 7.4% on 22 October 2026 and 15.9% on 23 October, Asianet Newsable reported. Transport was the largest single source, at 17.32%. The share changes daily with the number of fires and the wind direction.